Search Knowledge Base by Keyword
How to Check your Website’s Resource Usage in cPanel
It’s usually good to keep a track of your website’s resource usage. Tracking this is actually not so difficult.
Lets dive in to understand through this tutorial.
The first step, as usual, is to log in to your cPanel account.
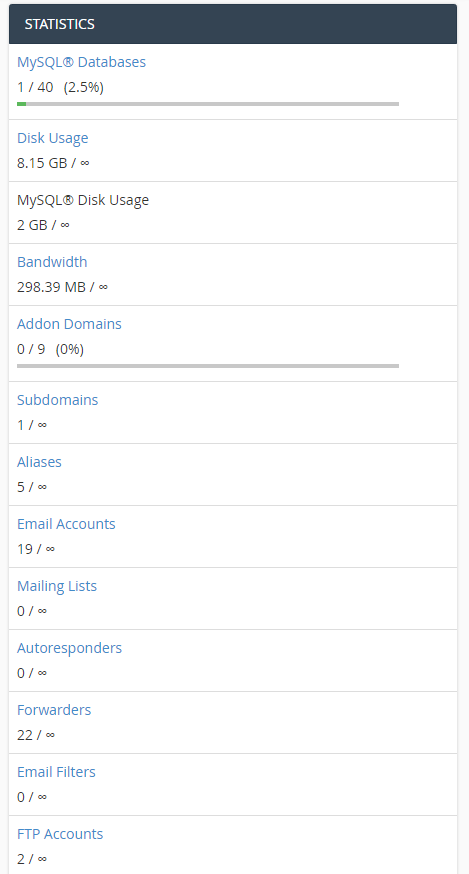
Once you are logged in, you will see the resource usage on the right hand side bar of your cPanel.
Scroll down and you will see your current server resource usage.
To view the resource usage history:
Locate and click on the “CPU and Concurrent Connection Usage” or “Resource Usage” under the Metrics section.
You will then be redirected to the Resource Usage Overview page. If your website did have issues it will show up here, but if not just click on the Details button to view the resource usage you wish to see.
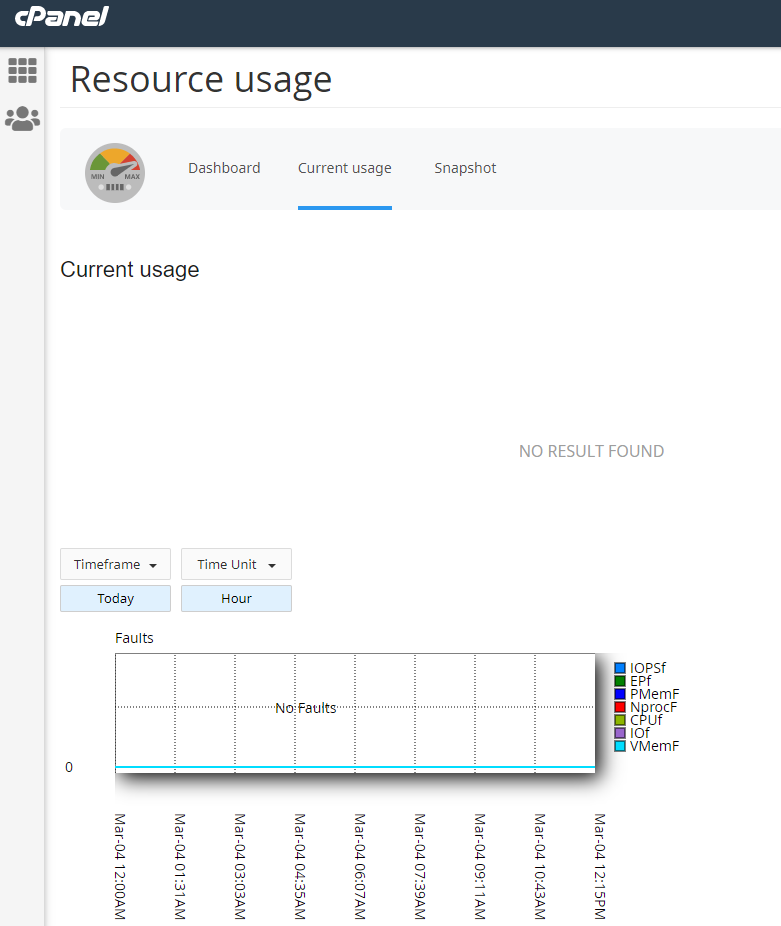
Once you clicked on Details, you will see the graph of the current usage. You can choose your desired timeframe to view and click Submit button.
You will also see the table showing the detailed usage statistics.
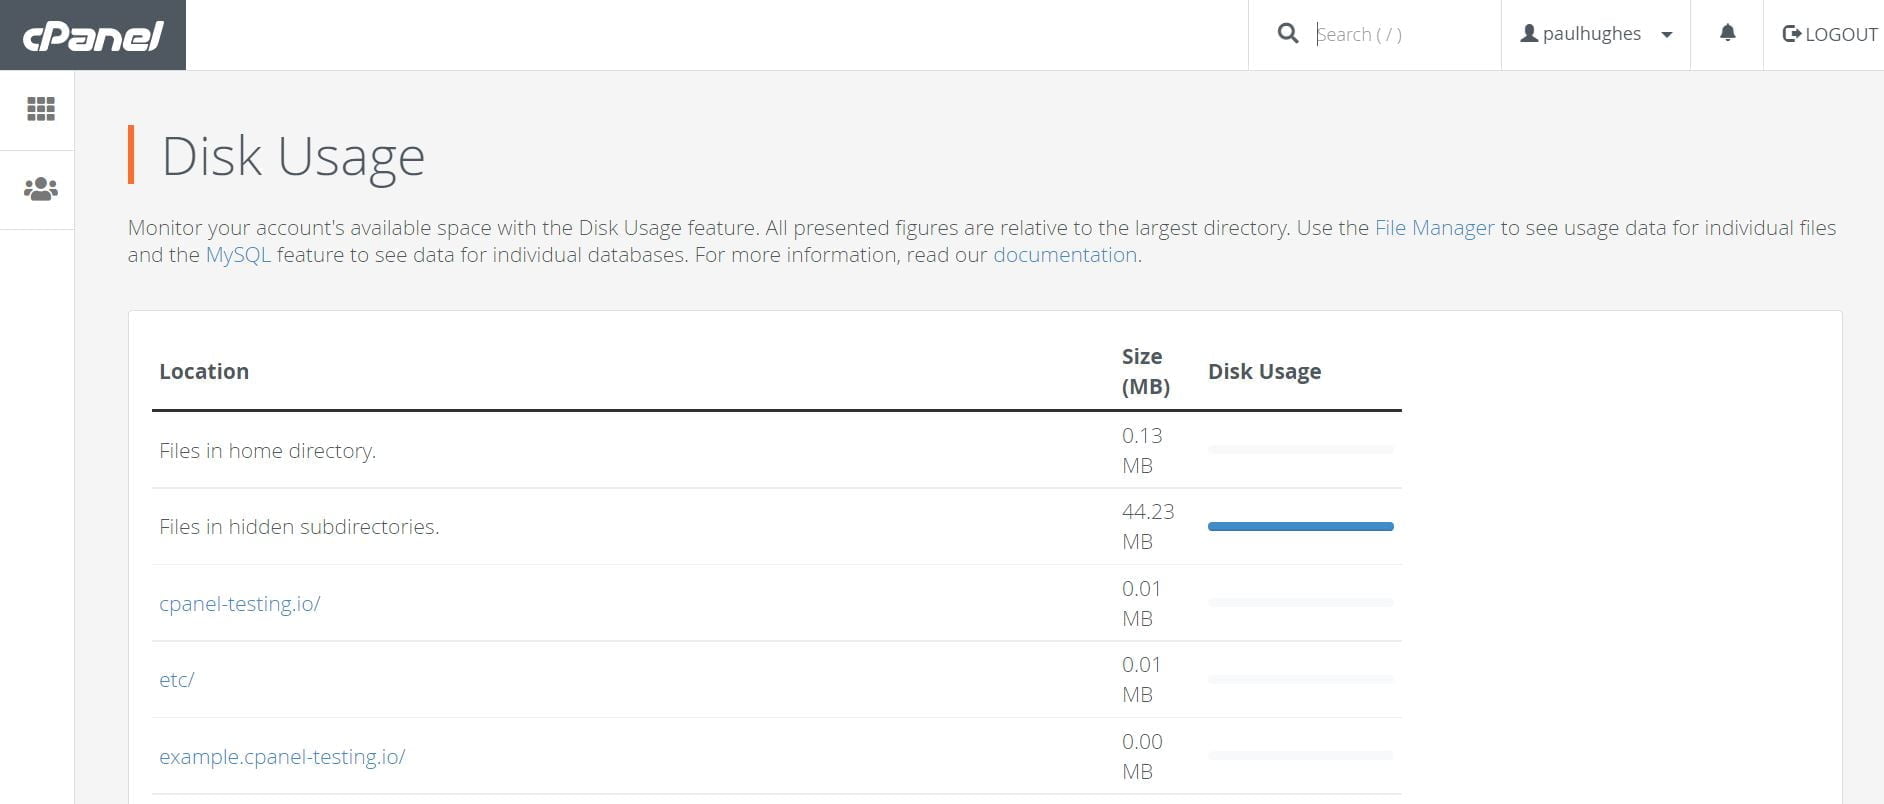
How to analyze disk usage?
In order to understand the disk usage, navigate to the disk usage icon in your cPanel dashboard. Here is how the screen looks like:
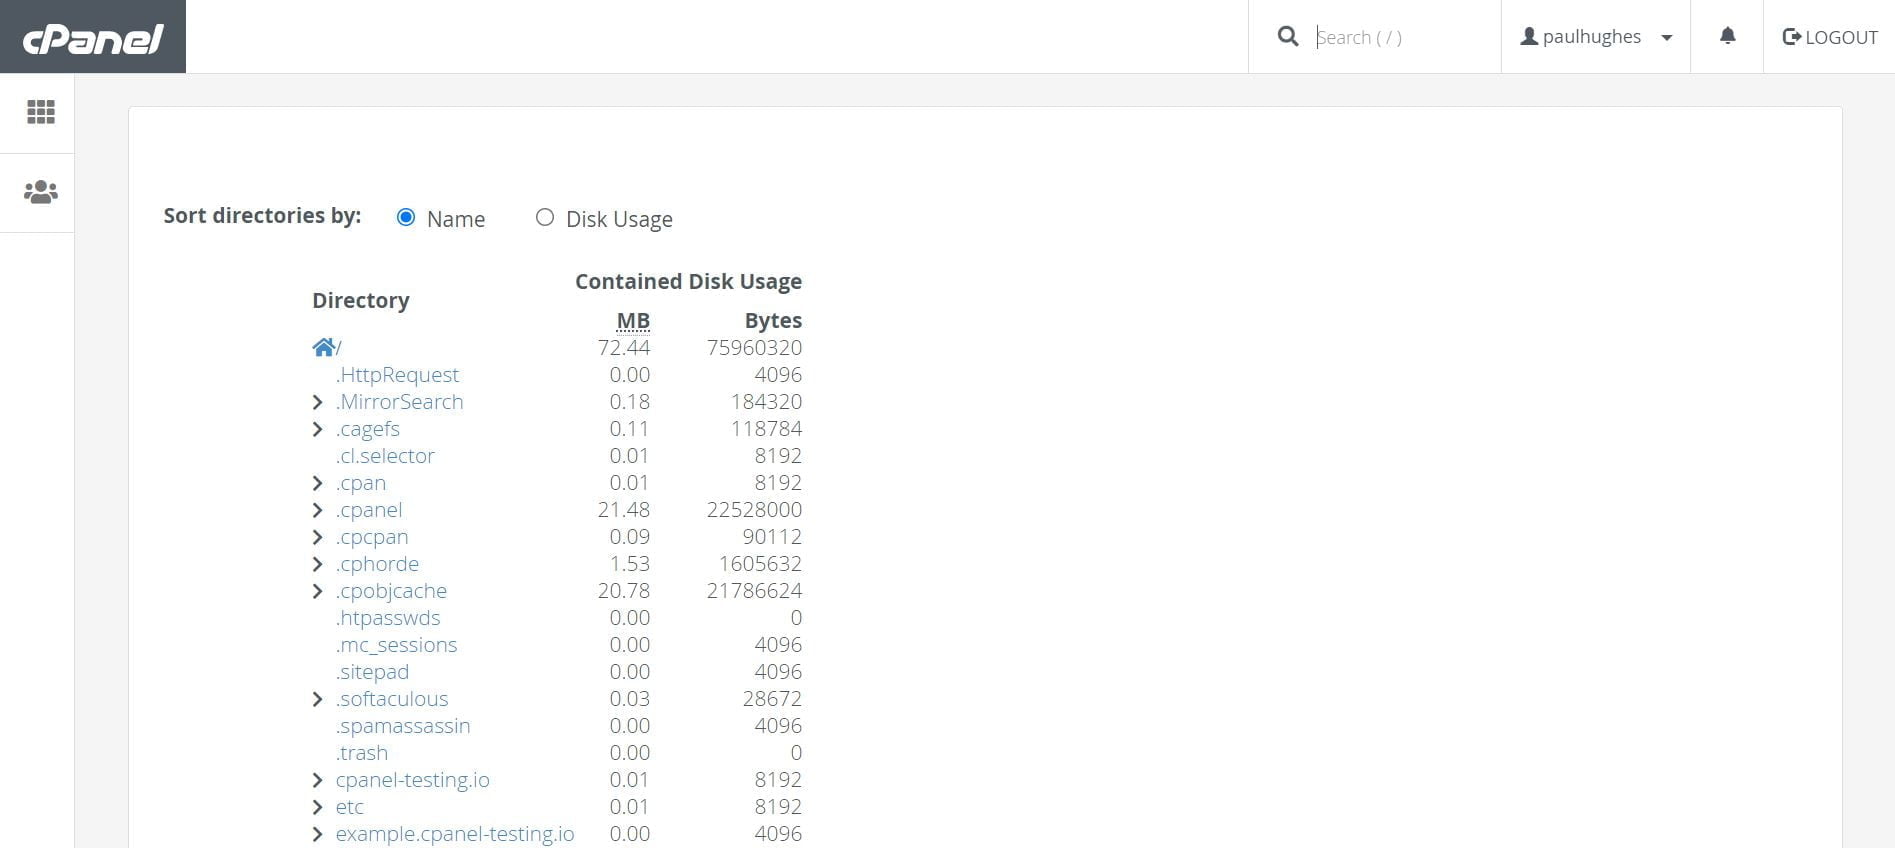
You can also sort the directories by name and disk usage so that you are aware of what is consuming the space quickly.
You can also check and analyze the usage-based from the Legend below.
Legend:
average/a – average used
limit/l – limit set for account
max/m – maximum used
f – failure
CPU – CPU limits
vMEM/vM – Virtual Memory limits
pMEM/pM – Physical Memory limits
EP – Entry Processes
nPROC/nP – Number of Processes
IO – Input/Output limits